
Eldorado Updates Lamaque Complex Technical Report; Demonstrating Significant Value and Potential to Extend Mine Life to 17 Years
(All dollar figures are in US dollars, unless otherwise stated)
The Reserve Case outlines an 8-year mine life producing 1.2 million ounces of gold, while the PEA Case shows the potential to extend mine life incrementally by 9 years and incremental gold production of 1.5 million ounces. The Lamaque Complex Technical Report has been filed on SEDAR+.
Lamaque Complex Technical Report Highlights
Table 1 summarizes key metrics for the Reserve Case and PEA Case from the Lamaque Complex Technical Report which are based on the Mineral Reserve and Mineral Resource estimates that are shown in Appendix A.
Highlights of the Reserve Case
-
Gold production of 1.2 million ounces over an 8-year mine life through 2032
-
Average annual gold production above ~175,000 oz through 2028
-
LOM All-In Sustaining Cost (“AISC”) of
$1,176 /oz Au3 -
Solid economics with an:
-
after-tax NPV(5%) of
$555 million at a gold price of$2,000 /oz -
after-tax NPV(5%) of
$1.1 billion at a gold price of$2,600 /oz
-
Highlights of the PEA Case
-
Incremental gold production of 1.5 million ounces, showing the potential to extend mine life to 17 years through 2041
-
Maintains average annual gold production of ~185,000 oz through 2036, providing a long runway for the
Lamaque Complex and the Company’s overall business inQuébec -
Maintains LOM AISC of
$1,149 /oz Au3 -
Significant incremental economics highlight the long-term potential of the
Lamaque Complex :-
after-tax NPV(5%) of
$623 million at a gold price of$2,000 /oz-
(for a total after-tax NPV(5%) of
$1.2 billion when combined with the Reserve Case)
-
-
after-tax NPV(5%) of
$1.1 billion at a gold price of$2,600 /oz Au-
(for a total after-tax NPV(5%) of
$2.1 billion when combined with the Reserve Case)
-
-
incremental IRR of the PEA case is 43.5% at a gold price of
$2,000 /oz Au-
68.2% at a gold price of
$2,600 /oz Au
-
-
1
2 The PEA case includes a non-material amount of Measured and Indicated Mineral Resources (< 2%).
3 These are forward looking non-IFRS measures or ratios. Refer to the section “Forward-Looking Non-IFRS and Other Financial Measures and Ratios” for explanations and discussions of these non-IFRS financial measures or ratios.
The PEA Case is preliminary in nature and includes Inferred Mineral Resources that are too speculative geologically to have economic considerations applied to them that would enable them to be categorized as Mineral Reserves and there is no certainty that the forecast production amounts will be realized. The basis for the PEA and the qualifications and assumptions made by the qualified persons who undertook the PEA are set out in the advisories contained in this news release. The results of the PEA had no impact on the results of any prefeasibility or feasibility study in respect of the
Maximizes installed capacity of plant and infrastructure with two mining centres. The installed capacity of the
Strong collaboration and support from the Val-d’Or communities. We expect a transparent and predictable regulatory environment, reflective of
Significant exploration potential to grow Mineral Resources in existing deposits. The Ormaque deposit remains open at depth and laterally both in the upper and lower sections of the deposit. The Triangle deposit remains open at depth and we continue to drill Plug No. 4 and other advanced targets on the property.
Well-positioned with a large, under-explored land package in the Val d’Or area. The Company continues to assess exploration opportunities across the
“This marks another major milestone for the
“Ormaque is located just off the existing Triangle–Sigma decline and was discovered through surface drilling in 2019 (see Figure 2 and Figure 3). An Inferred Mineral Resource was declared in
“The Ormaque and Triangle deposits are located within the prolific Val-d’Or district of the Abitibi. This district hosts the historic Lamaque and Sigma Mines, which collectively produced nearly 10 million ounces of gold. Based on the existing resource base and favorable findings of the report, we maintain an optimistic view of the long-term potential at the
“Our skilled and dedicated workforce, strategic position in the Abitibi region and collaborative relationships with First Nations and the local community, positions us to deliver sustainable, long-term benefits for the Val-d’Or region, while continuing to create value for our shareholders.”
Table 1: Key metrics based on the Lamaque Complex Technical Report
| Unit | Reserve Case (includes Mineral Reserves only) |
PEA Case (includes Inferred Mineral Resources2 and is incremental to Reserve Case) |
|
| Production | |||
|
|
yrs | 8 | 9 |
| Total Material Processed | Mt | 5.7 | 7.1 |
| Average Gold Grade | g/t | 6.55 | 6.78 |
| Total Gold Produced | koz | 1,168 | 1,500 |
| Operating Costs | |||
| Direct Operating Cost | $/t | 188 | 180 |
| Total Cash Cost3 | $/oz | 944 | 873 |
| AISC3 | $/oz | 1,176 | 1,156 |
| Capital Costs | |||
| Growth Capital Costs3 | US$M | 227 | 33 |
| Sustaining Capital Costs3 | US$M | 270 | 424 |
| Total Capital Cost | US$M | 497 | 457 |
| Economics @ |
|||
| LOM After-tax Cash Flow | US$M | 669 | 1,085 |
| After-tax NPV(5%) | US$M | 555 | 623 |
| IRR | % | n/a | 43.5 |
| Economics @ |
|||
| LOM After-tax Cash Flow | US$M | 1,257 | 1,788 |
| After-tax NPV(5%) | US$M | 1,064 | 1,059 |
| IRR | % | n/a | 68.2 |
2 The PEA case includes a non-material amount of Measured and Indicated Mineral Resources (< 2%).
3 These are forward looking non-IFRS measures or ratios. Refer to the section “Forward-Looking Non-IFRS and Other Financial Measures and Ratios” for explanations and discussions of these non-IFRS financial measures or ratios.
Figure 1: Lamaque Complex Production Profile (Reserve Case + PEA Case)
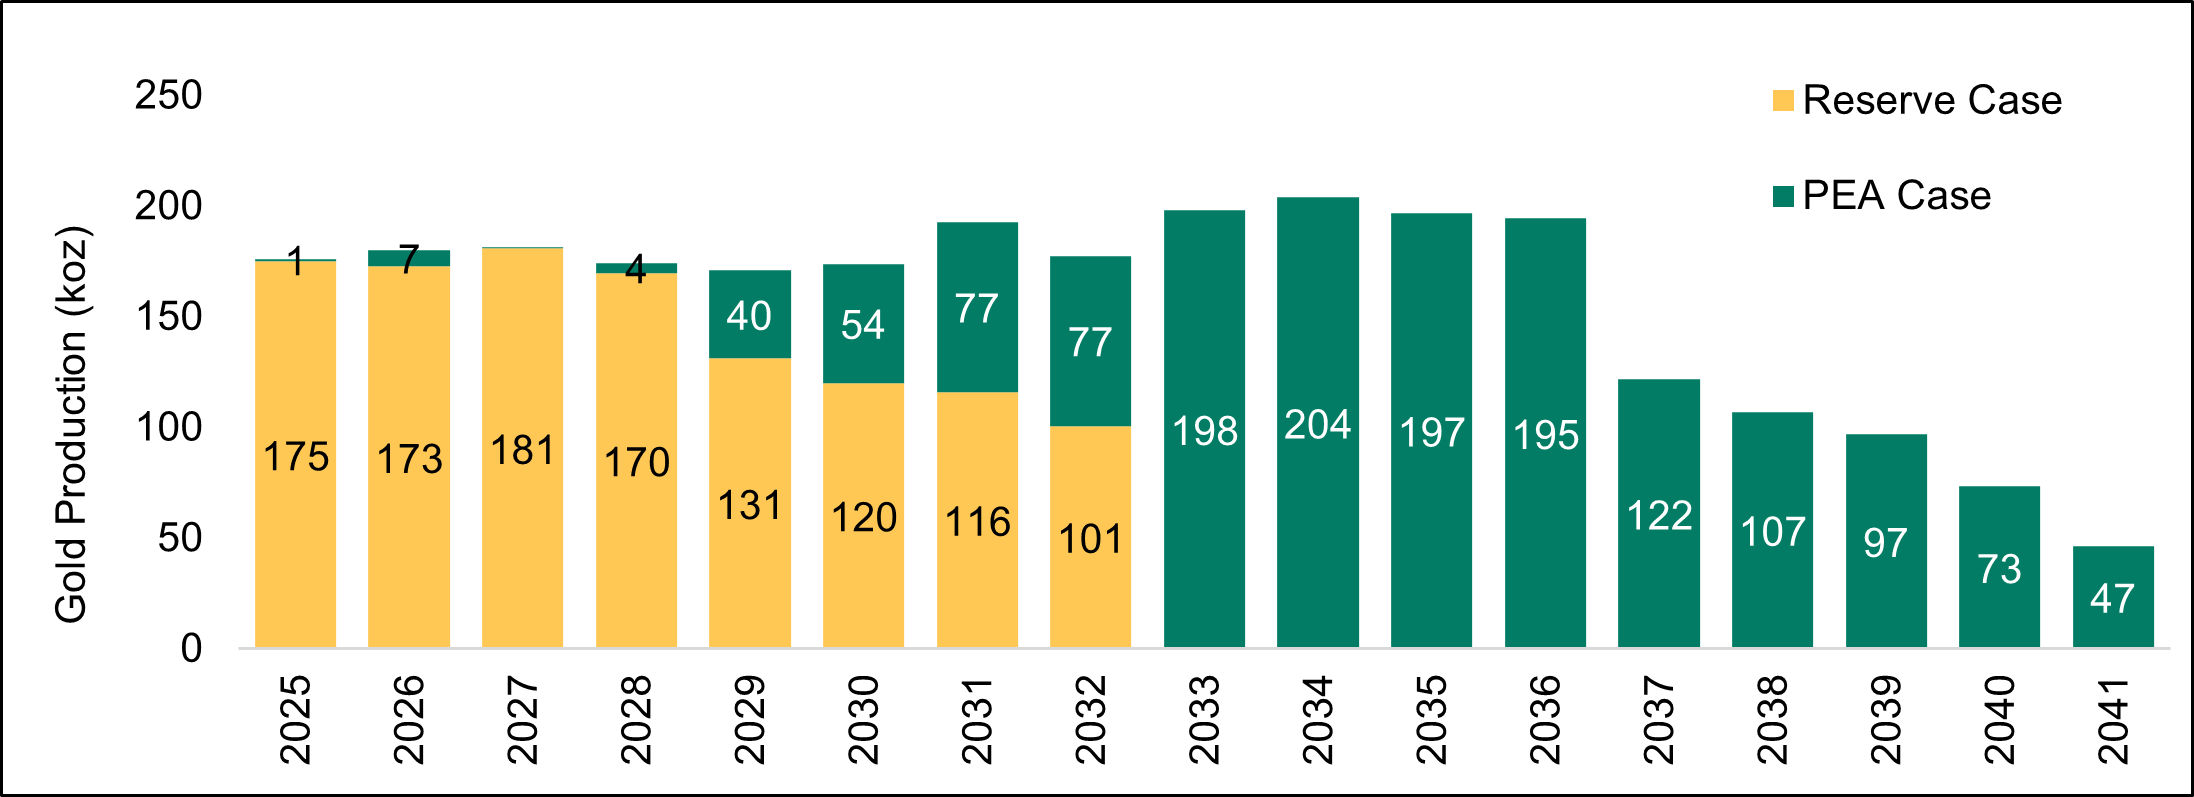
Figure 2:
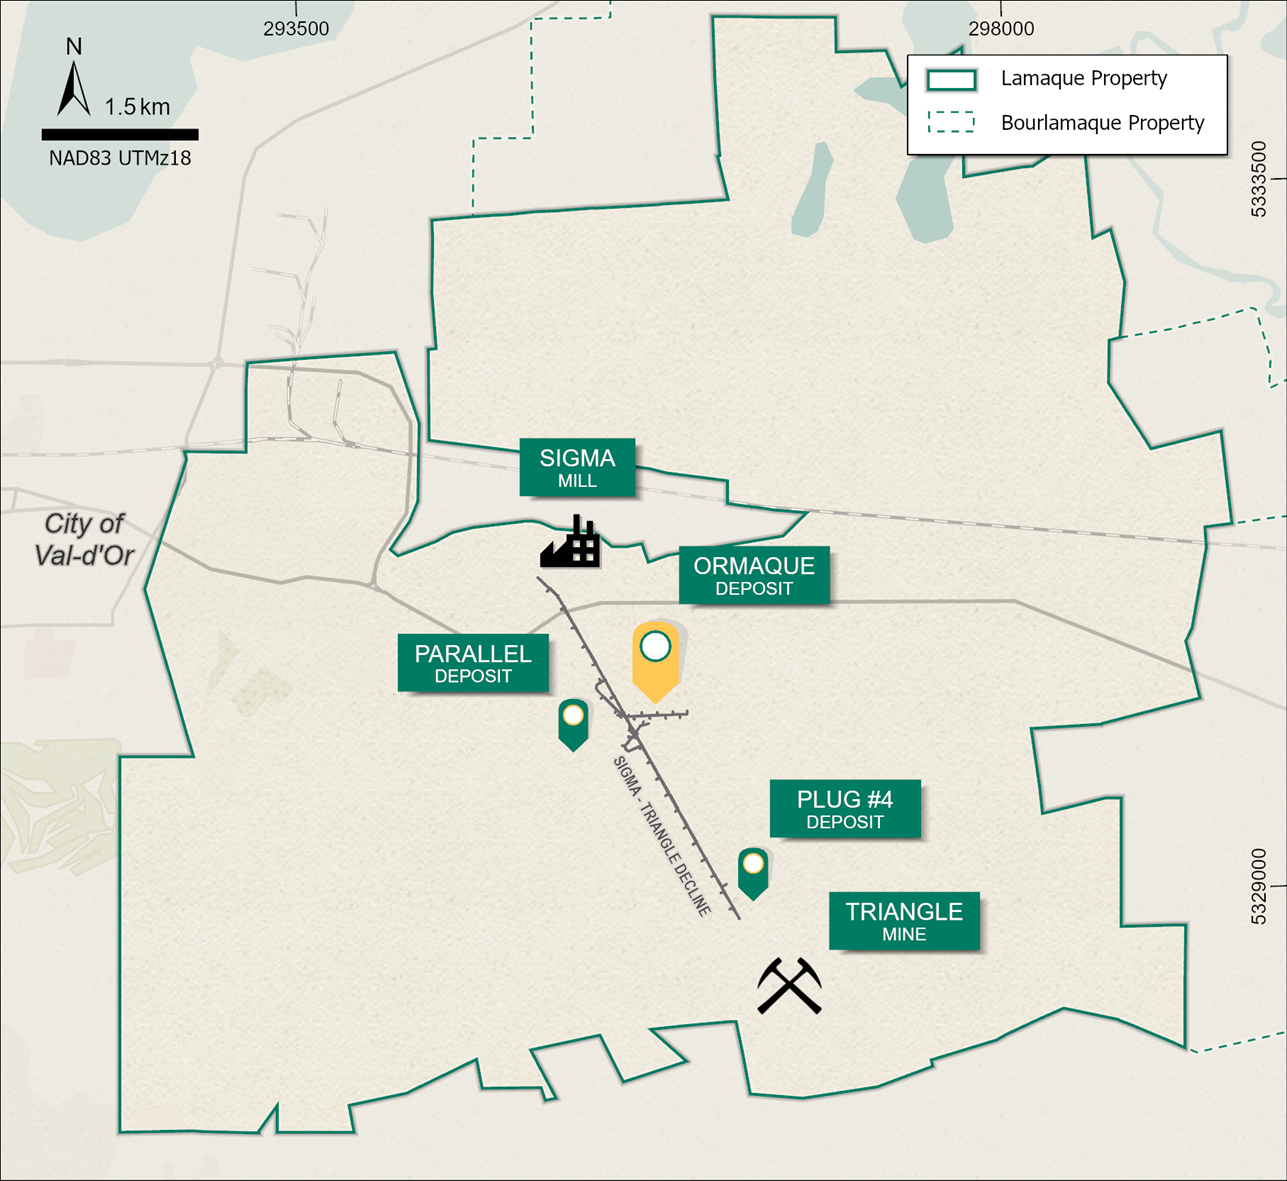
Figure 3:
Significant Value Creation Since Acquisition
Eldorado acquired the
Figure 4:
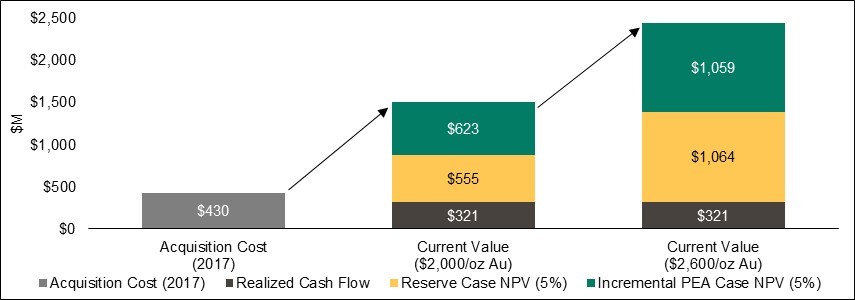
4 Acquisition cost is based on headline transaction of
5 Net cash flow generated from acquisition to December 31, 2024.
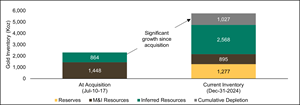
At the time of acquisition, the
Figure 5: Lamaque Complex Mineral Reserve and Mineral Resource Growth since acquisition (koz Au)6,7
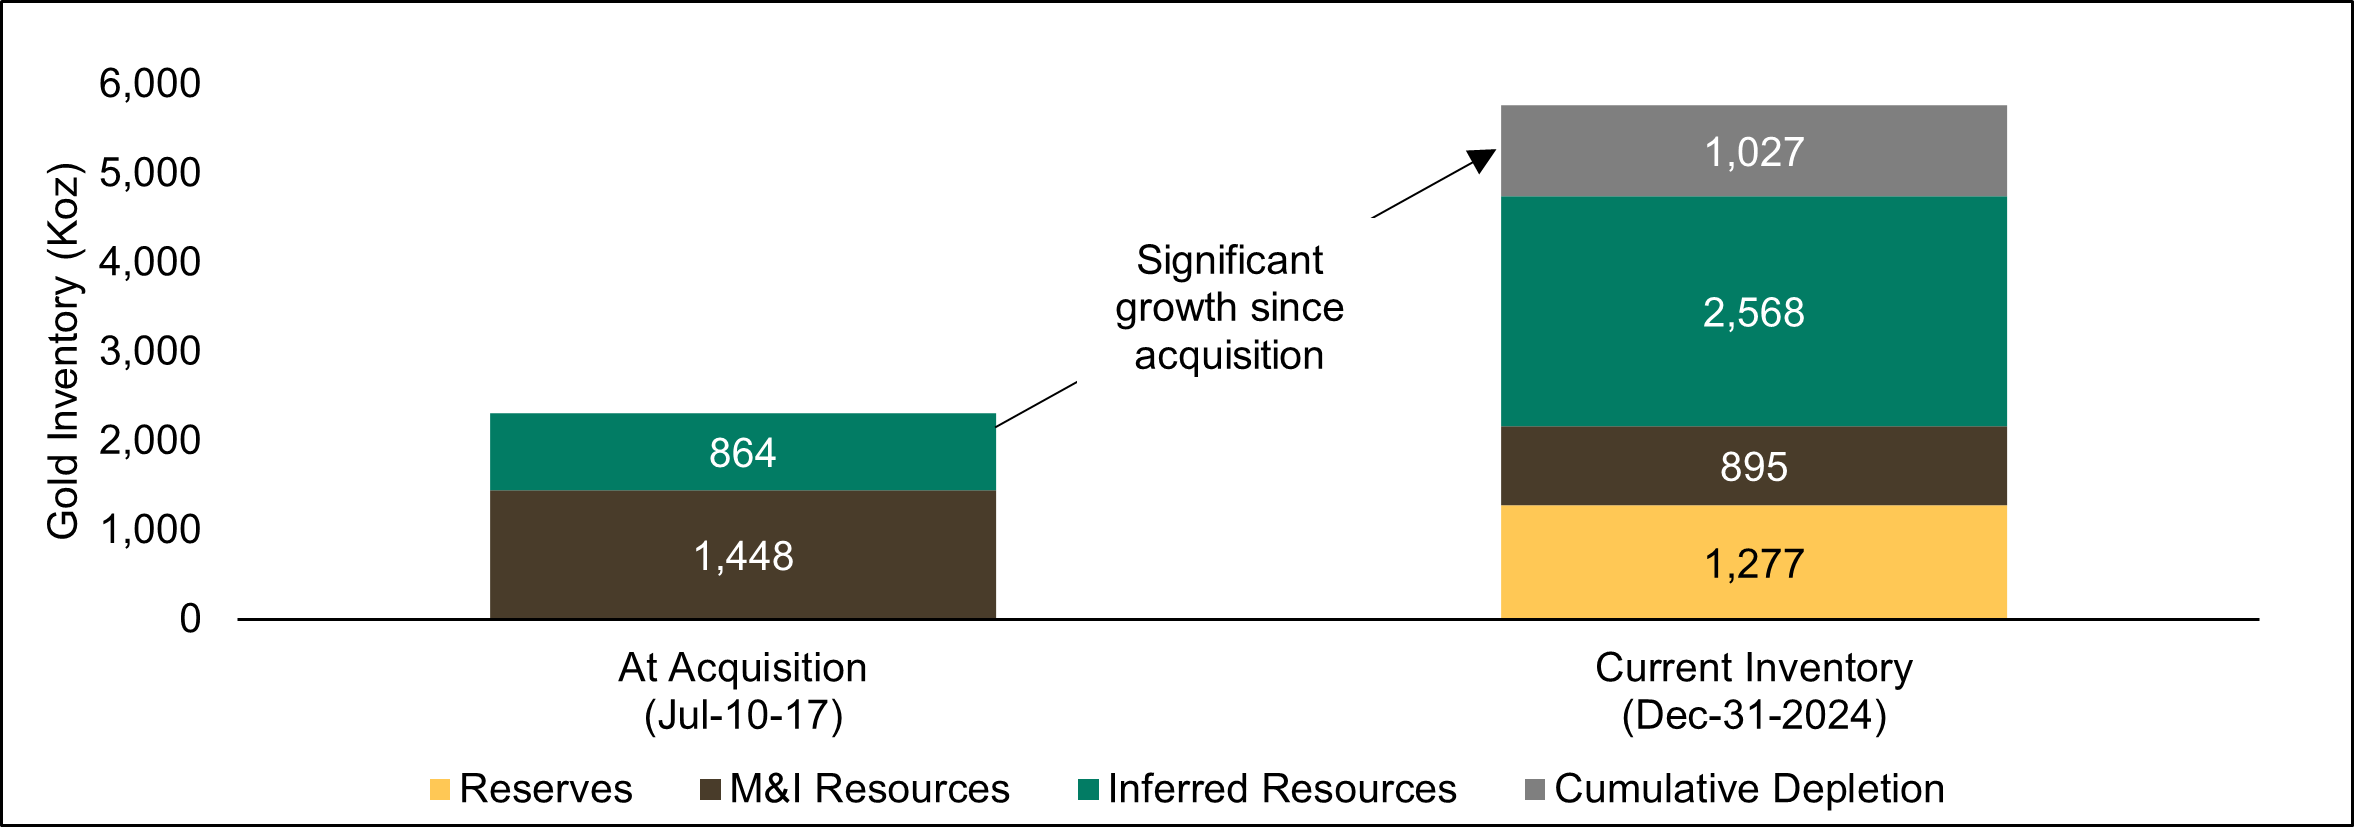
6 Depletion is based on contained gold processed as of
7 M&I Mineral Resources are exclusive of Mineral Reserves.
Lamaque Complex Planned Drilling and Regional Exploration
Exploration activities will continue at the
-
Resource conversion drilling at Lower Triangle, where a multi-year plan has been developed to leverage access to drill platforms as underground infrastructure advances, while targeting deeper veins (C8 and below) with longer drill holes with the objective of reducing geological risk ahead of development (see Figure 6).
-
Resource conversion drilling at Ormaque, where drilling during 2025 will focus on extending the core of the system at depth. Subsequent conversion drilling from 2026 onwards will be conditional upon ongoing exploration drilling that is testing lateral and depth extensions, and will prioritize domains of Inferred Mineral Resources that deliver maximum value for the operation (see Figure 7).
-
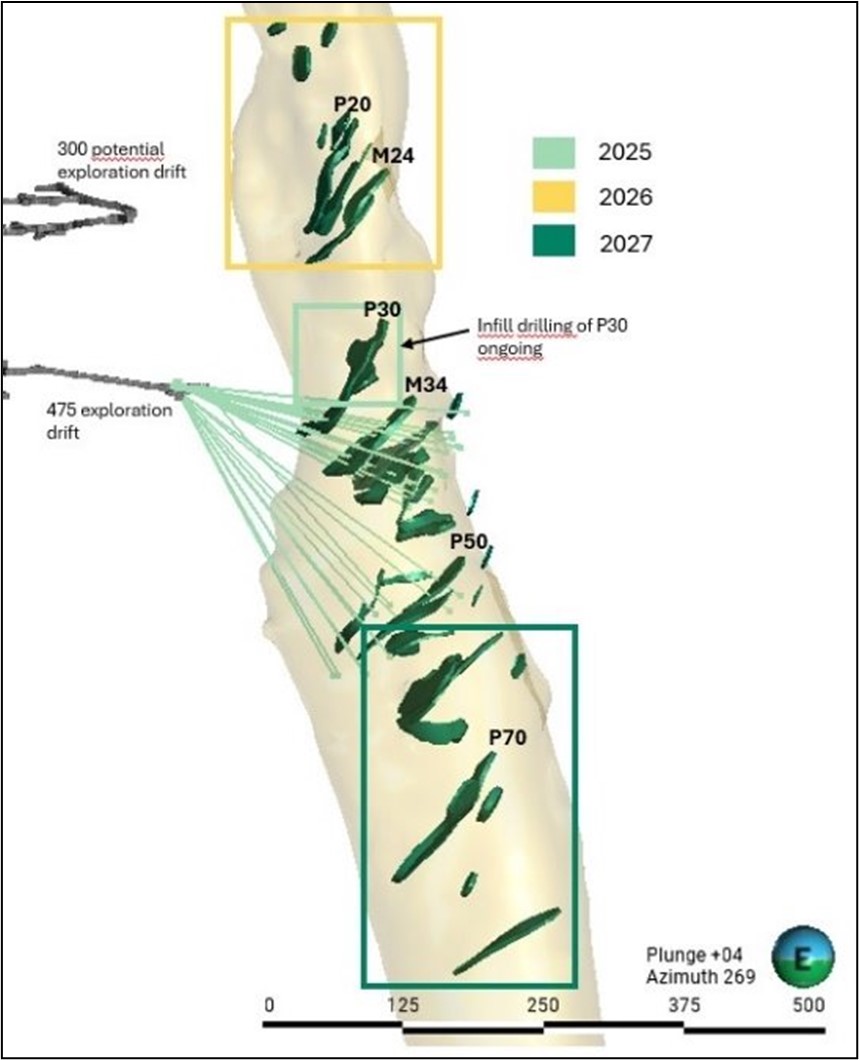
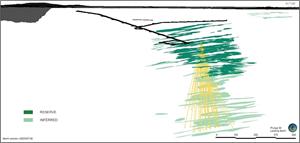
Resource conversion drilling at Plug No. 4 will continue during 2025 from an exploration drift located off the Sigma-Triangle decline. Drilling will test the P30 to P50 veins, and conditional drilling is planned for 2026 and 2027 targeting shallower and deeper vein sets (see Figure 8).
-
Surface drilling targeting additional Inferred Mineral Resources by testing lateral extensions of Ormaque, which remains open in all directions at various levels of the deposit, is planned through 2025.
-
In addition, exploration drilling from surface and underground will also test earlier stage targets proximal to the
Lamaque Complex infrastructure, including assessing the potential to extend known veins and testing new targets. In parallel, the Exploration team will continue to generate and drill test targets within the Eldorado land position in the wider district to assess future resource potential to feed theSigma Mill .
Figure 6 - Lower Triangle Mineral Resource conversion drilling (2025-2027)
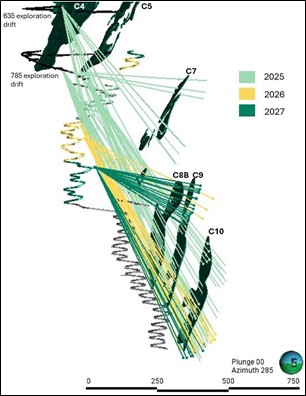
Figure 7 - Ormaque Mineral Resource conversion drilling (2025)
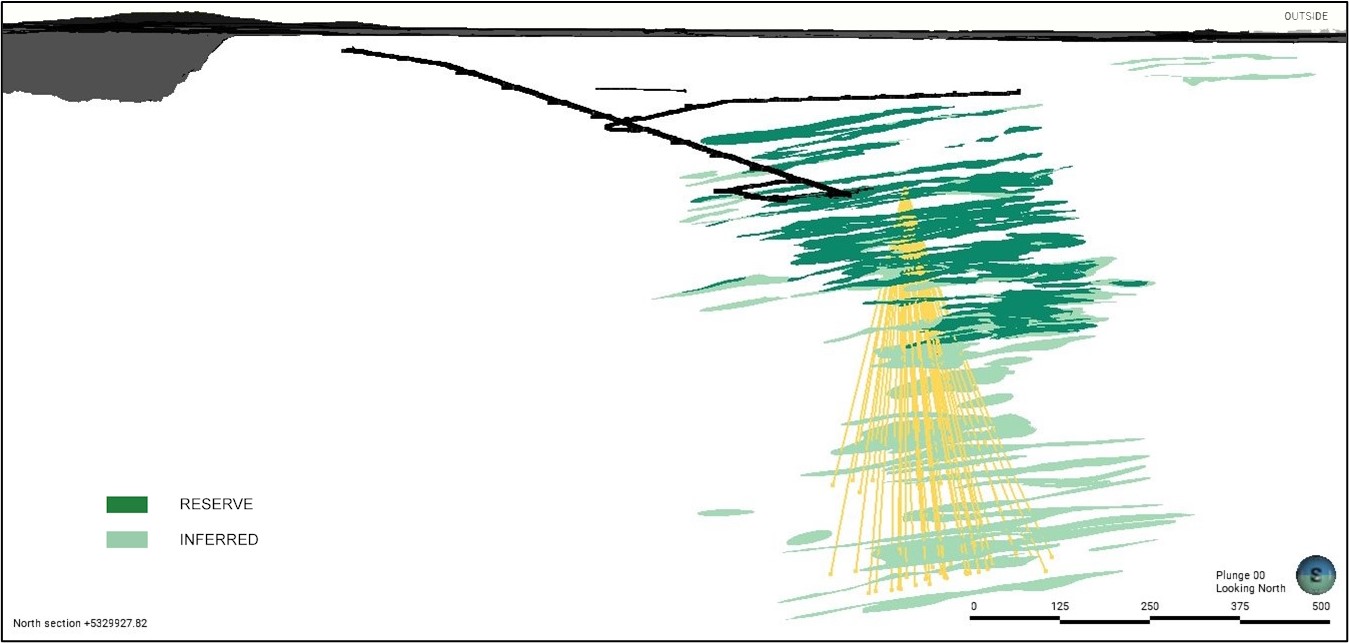
Figure 8 – Plug No. 4 Mineral Resource conversion drilling (2025, with conditional 2026-2027 conceptual plan)
Interactive VRIFY 3D Model
To view an interactive 3D model that includes updated views of the Mineral Reserve and Mineral Resource shells use the following link: https://vrify.com/decks/17646?auth=80334cc6-3e93-4722-ac41-9313e4c8591a or visit
About
Eldorado is a gold and base metals producer with mining, development and exploration operations in Türkiye,
Contact
Investor Relations
647 271 2827 or 1 888 353 8166
Media
236 885 6251 or 1 888 353 8166
ADVISORIES AND DETAILED NOTES ON MINERAL RESERVES AND RESOURCES
General
Mineral Resources and Mineral Reserves are as of
Mineral Reserves are included in the Mineral Resources.
Measured and Indicated Mineral Resources which are not Mineral Reserves do not have demonstrated economic viability. With respect to “Inferred Mineral Resources”, there is a great amount of uncertainty as to their existence and a great uncertainty as to their economic and legal feasibility. It cannot be assumed that all or any part of a “Measured Mineral Resource”, “Indicated Mineral Resource” or “Inferred Mineral Resource” will ever be upgraded to a higher category.
Additional information regarding the
Unless otherwise noted in this new release,
Cautionary Note to US Investors Concerning Estimates of Measured, Indicated and Inferred Resources
There are differences between the standards and terms used for reporting mineral reserves and resources in
These standards differ from the requirements of the
Mineral Reserve Notes
Eldorado reports Mineral Reserves in accordance with CIM Definition Standards. Mineral Reserves for the
-
Long-Term Metal Price Assumptions
-
Gold price:
$1,450 /oz -
Silver price:
$19.00 /oz -
Copper price:
$2.75 /lb -
Lead price:
$2,000 /t -
Zinc price:
$2,500 /t
-
-
Cut-off Grades / Values
Lamaque Complex : 4.99 g/t (long hole stoping, Triangle and Parallel): 5.67 g/t (drift and fill, Ormaque) -
Qualified Persons
The following persons, all of whom are qualified persons under NI 43-101, have approved the disclosure relating to Mineral Reserves contained within this release:
| Asset | Mining Type(s) | Qualified Person | Company |
Triangle, Parallel, Plug No.4 |
Underground |
, géo (OGQ No. 758) |
( |
Ormaque |
Underground | Phillippe Groleau, Eng, (OIQ No. 5032770) Senior Strategic Planner |
( |
Mineral Resource Notes
Eldorado reports Mineral Resources in accordance with CIM Definition Standards. All Mineral Resources are assessed for reasonable prospects for eventual economic extraction (RPEEE). The Resource cut-off grades or values (e.g. gold equivalent) are determined using a long-term gold price (
Underground Resources were constrained by volumes whose design was guided by a combination of the reporting cut-off grade or value, contiguous areas of mineralization and mineability. Eldorado’s Mineral Resources are inclusive of Reserves.
-
Long-Term Metal Price Assumptions:
-
Gold price:
$1,800 /oz
-
-
Mineral Resource Reporting and demonstration of Reasonable Prospects for Eventual Economic Extraction:
The Mineral Resources used a long term look gold metal price of$1,800 /oz for the determination of resource cut-off grades or values. This guided execution of the next step where constraining surfaces or volumes were created to control resource reporting. Underground Resources were constrained by 3D volumes whose design was guided by the reporting cut-off grade or value, contiguous areas of mineralization and mineability. Only material internal to these volumes were eligible for reporting.
Cut-off GradesLamaque Complex (Triangle, Plug No. 4, Parallel and Ormaque): 3.5 g/t Au -
Qualified Persons
The following persons, all of whom are qualified persons under NI 43-101, have approved the disclosure regarding Mineral Resources contained within this release:
| Asset | Mining Type(s) | Qualified Person | Company |
Triangle, Parallel, Plug No. 4 |
Underground |
, géo (OGQ No. 758). |
( |
Ormaque |
Underground |
, géo (OGQ No. 758) |
( |
Notes on the PEA
Readers should take care to differentiate the PEA discussed in this news release from the economic analysis for the Lamaque Complex Mineral Reserves. The PEA only demonstrates the potential viability of Inferred Mineral Resources and is not as comprehensive as the economic analysis for the Lamaque Complex Mineral Reserves. The level of detail, precision and confidence in outcomes between the economic analysis for the Lamaque Complex Mineral Reserves and the Lamaque Complex Mineral Resources described in the PEA is significantly different.
The PEA is preliminary in nature and is based on numerous assumptions and the incorporation of Inferred Mineral Resources. Inferred Mineral Resources are considered too speculative geologically to have economic considerations applied to them that would enable them to be categorized as Mineral Reserves except as allowed for by National Instrument 43-101 in PEA studies. There is no guarantee that Inferred Mineral Resources can be converted to Indicated or Measured Mineral Resources and, as such, there is no guarantee that the economics described herein will be achieved. Mineral Resources that are not Mineral Reserves do not have demonstrated economic viability.
The PEA Case is preliminary in nature and includes Inferred Mineral Resources that are too speculative geologically to have economic considerations applied to them that would enable them to be categorized as Mineral Reserves and there is no certainty that the forecast production amounts will be realized. The results of the PEA had no impact on the results of any prefeasibility or feasibility study in respect of the
The Qualified Person made various assumptions in preparing the PEA, including the following: physical assumptions about mining dilution, rate of development, milling throughput and recovery rate (including mining rate decrease due to depth); future gold prices, exchange rates and energy costs; operating expenses including mining and processing costs; capital expenditures required to execute the incremental plan; continuation of existing mining methods, process plans and business operations; the Company's ability to obtain all required approvals and permits in a timely manner and its ability to comply with any associated conditions of those approvals and permits; and the future geopolitical, economic, permitting and legal climate applicable to the
Even though the Qualified Person believes that the assumptions made in preparing the PEA are reasonable, many assumptions may be difficult to predict and are beyond our control.
Forward-Looking Non-IFRS Financial Measures and Ratios
Certain non-IFRS forward-looking measures related to the
With respect to the non-IFRS measures disclosed in this news release, the Company defines them as follows:
Total Cash Costs
We define total cash costs following the recommendations of the Gold Institute Production Cost Standard. The production cost standard developed by the
All-In Sustaining Costs (AISC)
We define AISC based on the definition set out by the
Sustaining Capital
Sustaining capital is capital required to maintain current operations at existing levels, including capitalized stripping and underground mine development. Sustaining capital excludes non-cash sustaining lease additions, unless otherwise noted, and does not include capitalized interest, expenditure related to development projects, or other growth or sustaining capital not related to operating gold mines.
Growth Capital
Growth capital is capital investment for new operations, major growth projects or enhancement capital for significant infrastructure improvements at existing operations.
Our
Our
| Three months ended Sept 30/24 | Three months ended Sept 30/23 | Nine months ended Sept 30/24 | Nine months ended Sept 30/23 | |
| Total cash costs ($/oz sold) | 728 | 648 | 755 | 697 |
| AISC ($/oz sold) | 1,189 | 1,099 | 1,228 | 1,143 |
| Sustaining Capital ($M) | 20.4 | 18.3 | 62.3 | 52.9 |
| Growth Capital ($M) | 6.4 | 8.2 | 18.9 | 15.3 |
The forward-looking total cash costs, AISC, sustaining capital and growth capital disclosed in this news release have been calculated consistent with both the methodology noted above and the methodology underpinning the disclosures in the
Cautionary Note about Forward-Looking Statements and Information
Certain of the statements made and information provided in this press release are forward-looking statements or information within the meaning of the United States Private Securities Litigation Reform Act of 1995 and applicable Canadian securities laws. Often, these forward-looking statements and forward-looking information can be identified by the use of words such as “anticipates”, “believes”, “budget”, “continue”, “estimates”, “expects”, “forecasts”, “guidance”, “intends”, “plans”, “projected” or “scheduled” or the negatives thereof or variations of such words and phrases or statements that certain actions, events or results “may”, “could”, “would”, “might” or “will” be taken, occur or be achieved.
Forward-looking statements or information contained in this release include, but are not limited to, statements or information with respect to the expectations regarding the Reserve Case and the PEA Case for the
Forward-looking statements and forward-looking information by their nature are based on assumptions and involve known and unknown risks, market uncertainties and other factors, which may cause the actual results, performance or achievements of the Company to be materially different from any future results, performance or achievements expressed or implied by such forward-looking statements or information.
We have made certain assumptions about the forward-looking statements and information, including assumptions about: our ability to execute our planned mining activities at the
Even though our management believes that the assumptions made and the expectations represented by such statements or information are reasonable, there can be no assurance that the forward-looking statement or information will prove to be accurate. Many assumptions may be difficult to predict and are beyond our control.
Furthermore, should one or more of the risks, uncertainties or other factors materialize, or should underlying assumptions prove incorrect, actual results may vary materially from those described in forward-looking statements or information. These risks, uncertainties and other factors include, among others, risks relating to our operations; community relations and social license; liquidity and financing risks; climate change; inflation risk; environmental matters; production and processing; waste disposal; geotechnical and hydrogeological conditions or failures; the global economic environment; risks relating to any pandemic, epidemic, endemic or similar public health threats; reliance on a limited number of smelters and off-takers; labour (including in relation to employee/union relations, employee misconduct, key personnel, skilled workforce, and contractors); indebtedness (including current and future operating restrictions, implications of a change of control, ability to meet debt service obligations, the implications of defaulting on obligations and change in credit ratings); government regulation; the Sarbanes-Oxley Act; commodity price risk; mineral tenure; permits; risks relating to environmental sustainability and governance practices and performance; financial reporting (including relating to the carrying value of our assets and changes in reporting standards); non-governmental organizations; corruption, bribery and sanctions; information and operational technology systems; litigation and contracts; estimation of mineral reserves and mineral resources; different standards used to prepare and report mineral reserves and mineral resources; credit risk; price volatility, volume fluctuations and dilution risk in respect of our shares; actions of activist shareholders; reliance on infrastructure, commodities and consumables (including power and water); currency risk; interest rate risk; tax matters; dividends; reclamation and long-term obligations; acquisitions, including integration risks, and dispositions; regulated substances; necessary equipment; co-ownership of our properties; the unavailability of insurance; conflicts of interest; compliance with privacy legislation; reputational issues; competition. as well as those risk factors discussed in the sections titled “Forward-looking information and risks” and “Risk factors in our business” in our most recent Annual Information Form & Form 40-F. The reader is directed to carefully review the detailed risk discussion in our most recent Annual Information Form & Form 40-F filed on SEDAR+ and EDGAR under our Company name, which discussion is incorporated by reference in this release, for a fuller understanding of the risks and uncertainties that affect our business and operations.
The inclusion of forward-looking statements and information is designed to help you understand management’s current views of our near- and longer-term prospects, and it may not be appropriate for other purposes.
There can be no assurance that forward-looking statements or information will prove to be accurate, as actual results and future events could differ materially from those anticipated in such statements. Accordingly, you should not place undue reliance on the forward-looking statements or information contained herein. Except as required by law, we do not expect to update forward-looking statements and information continually as conditions change and you are referred to the full discussion of the Company’s business contained in the Company’s reports filed with the securities regulatory authorities in
APPENDIX A – Mineral Reserves and Mineral Resources
Table 2: Lamaque Complex Mineral Reserves as of
| Proven Mineral Reserves | Probable Mineral Reserves | Proven & Probable Mineral Reserves | |||||||
| Tonnes | Grade | Contained | Tonnes | Grade | Contained | Tonnes | Grade | Contained | |
| (x1000) | g/t | ounces (x 1000) | (x1000) | g/t | ounces (x 1000) | (x1000) | g/t | ounces (x 1000) | |
| Triangle, Parallel | 1,357 | 5.70 | 249 | 1,956 | 6.50 | 409 | 3,313 | 6.19 | 658 |
| Ormaque | 3 | 7.76 | 1 | 2,661 | 7.22 | 618 | 2,664 | 7.22 | 619 |
| Total | 1,360 | 5.72 | 250 | 4,617 | 6.92 | 1,027 | 5,977 | 6.65 | 1,277 |
1 Values may not sum due to rounding. Mineral Resources are inclusive of Mineral Reserves.
Table 3: Lamaque Complex Mineral Resources as of
| Measured Mineral Resources | Indicated Mineral Resources | M&I Mineral Resources | Inferred Mineral Resources | |||||||||
| Tonnes | Grade | Contained | Tonne | Grade | Contained | Tonnes | Grade | Contained | Tonnes | Grade | Contained | |
| (x1000) | g/t | oz (x 1000) | (x1000) | g/t | oz (x 1000) | (x1000) | g/t | oz (x 1000) | (x1000) | g/t | oz (x 1000) | |
| Triangle, Plug No. 4, Parallel | 2,269 | 6.55 | 477 | 4,367 | 6.74 | 947 | 6,636 | 6.67 | 1,424 | 8,188 | 6.58 | 1,731 |
| Ormaque | 3 | 7.76 | 1 | 1,414 | 16.44 | 747 | 1,417 | 16.41 | 748 | 1,750 | 14.87 | 837 |
| Total | 2,272 | 6.55 | 478 | 5,781 | 9.12 | 1,694 | 8,053 | 8.39 | 2,172 | 9,938 | 8.04 | 2,568 |
1 Values may not sum due to rounding.
For further information including the ‘Advisories and Detailed Notes on Mineral Reserves and Resources’ please see the news release dated
Photos accompanying this announcement are available at
https://www.globenewswire.com/NewsRoom/AttachmentNg/452691fc-7c53-4c97-97a5-3d20c146e4a7
https://www.globenewswire.com/NewsRoom/AttachmentNg/8058066e-4ef0-4480-adfd-85927ceeb1ef
https://www.globenewswire.com/NewsRoom/AttachmentNg/d286f7b3-7cdd-494f-b616-dab76b5242dd
https://www.globenewswire.com/NewsRoom/AttachmentNg/b3e709e5-e485-4913-862b-af0a77d83bd1
https://www.globenewswire.com/NewsRoom/AttachmentNg/f8df9876-710a-4024-9d95-cc4ce2f52ce7
https://www.globenewswire.com/NewsRoom/AttachmentNg/af50acab-a22a-4699-b693-fc910aada8c0
https://www.globenewswire.com/NewsRoom/AttachmentNg/eaf06afb-bf0a-404c-af19-d506788cf5fd
https://www.globenewswire.com/NewsRoom/AttachmentNg/19fe21c9-79ff-4dfc-a4c7-16ddb7b148bf
![]()
![]()
Figure 1

Lamaque Complex Production Profile (Reserve Case + PEA Case)
Figure 2
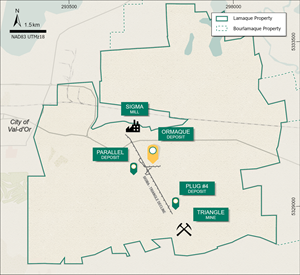
Lamaque Complex property map showing location of gold deposits and key infrastructure
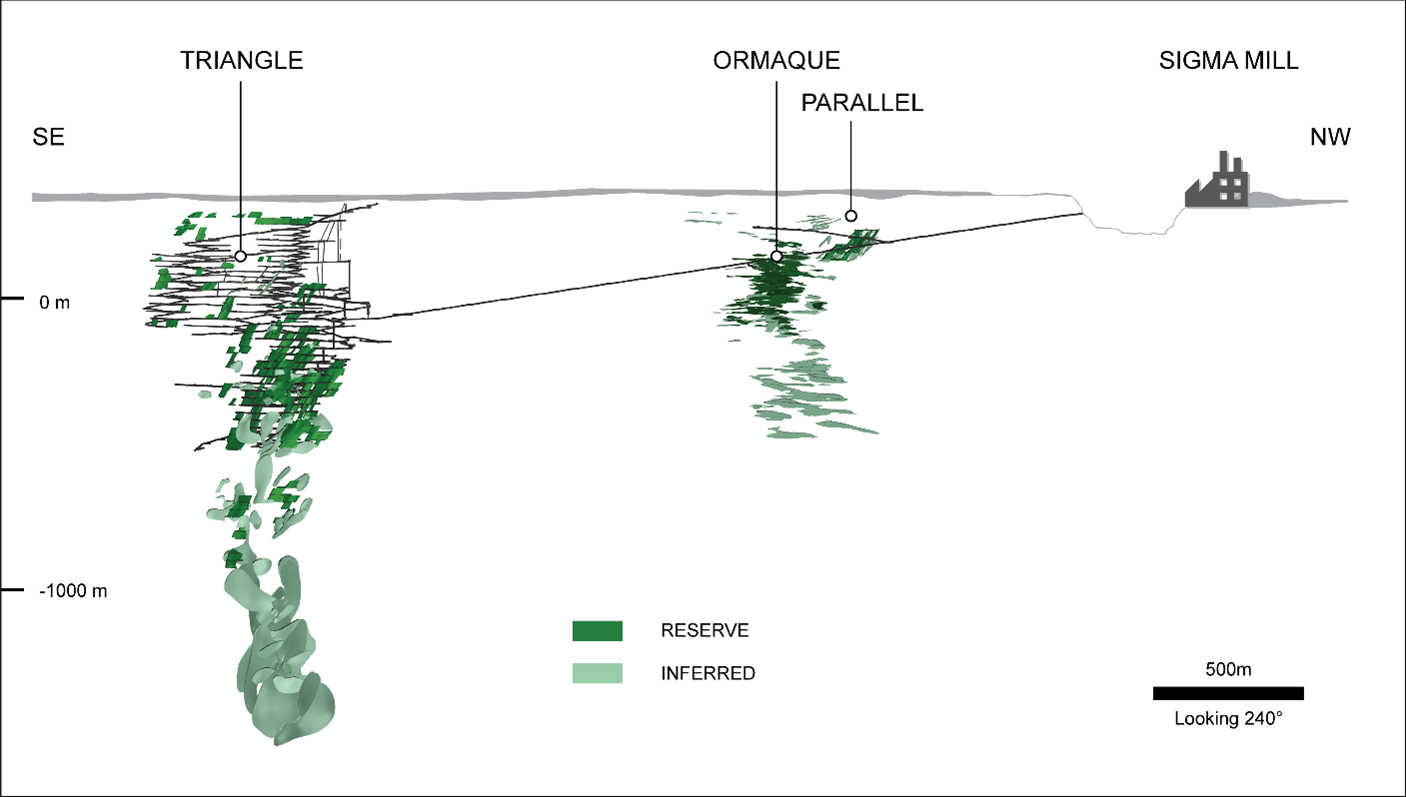
Figure 3
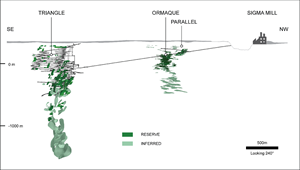
Lamaque Complex long-section showing location of gold deposits and key infrastructure
Figure 4

Lamaque Complex track record of value creation since acquisition (US$ million)
Figure 5
Lamaque Complex track record of Mineral Reserve and Mineral Resource Growth since acquisition (
Koz Au )5
Figure 6

Lower Triangle resource conversion drilling (2025-2027)
Figure 7
Ormaque resource conversion drilling (2025)
Figure 8
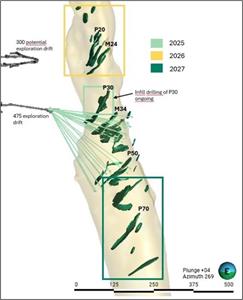
Plug No. 4 resource conversion drilling (2025, with conditional 2026-2027 conceptual plan)
Source: